- Methodology
- Open access
- Published:
Analysis and simulation of plant disease progress curves in R: introducing the epifitter package
Phytopathology Research volume 3, Article number: 22 (2021)
Abstract
The analysis of the disease progress curves (DPCs) is central to understanding plant disease epidemiology. The shape of DPCs can vary significantly and epidemics can be better understood and compared with an appropriate depiction and analysis. This paper introduces epifitter, an open-source tool developed in R for aiding in the simulation and analysis of DPC data. User-level functions were developed and their use is demonstrated to the reader using actual disease progress curve data for facilitating the conduction of several tasks, including (a) simulation of synthetic DPCs using four population dynamics models (exponential, monomolecular, logistic, and Gompertz); (b) calculation of the areas under disease progress curve and stairs; (c) fitting and ranking the four above-mentioned models to single or multiple DPCs; and (d) generation and customization of graphs. The package requires the installation of R in any desktop computer and the scripted analysis can be fully documented, reproduced, and shared. The epifitter R package provides a flexible suite for temporal analysis of epidemics that is useful for both research and teaching purposes.
Background
Plant disease epidemics can be defined as "the change in disease intensity in a population of susceptible host plants over time and space" (Madden et al. 2007). As long as conditions are favorable for a pathogen population to infect, colonize, and reproduce in its host population, an epidemic may occur and spread and, occasionally, occupy large geographic areas in a short time. Although the latter case is rare, epidemics are undergoing as long as these two populations of individuals meet together and encounter a favorable environment, regardless of the magnitude of the disease intensity (Madden et al. 2007).
The reasons for studying plant disease epidemics are multifold and can be practical or more fundamental. A lot can be learned from the study of the "progress" of epidemics, typically represented by a disease progress curve (DPC), which is a "graph" or "signature" of an epidemic, within which the spatial dimension is implicit (Kranz and Rotem 1988; Campbell and Madden 1990; Kranz 2003). A DPC, which can be obtained as long as the amount of disease (y) in a plant population is assessed sequentially in time (t), integrates the effects of the three main elements of the disease triangle occurring during the epidemic.
The analysis of DPC data can provide useful information for gaining understanding of underlying epidemic processes. Indeed, the shapes of the DPCs may vary widely and the characteristics of the epidemics can be discerned by their appropriate depiction and analysis (Van der plank 1963; Kranz 2003). Usually, one is interested in describing and comparing epidemics that result from different treatments or natural environmental variation, which can be accomplished through temporal analysis of epidemics; or the analysis of a collection of DPCs (Campbell and Madden 1990).
Temporal analysis has many facets of varying complexity. The simplest case is the appraisal of the disease intensity at any time during the epidemic, and such "single-point" assessment can be sufficient for certain diseases. A case of intermediate complexity is the calculation of the area under the disease progress curve (AUDPC), proposed by Van der Plank (1963); a value that summarizes the "total measure of disease stress", or its mathematical modification called AUDPS (the area under the disease progress stairs) that corrects the underestimation of the effects of the first and last evaluation by AUDPC (Simko and Piepho 2012). At a higher level of complexity, mathematical models can be fitted to the data to express epidemic progress in terms of rates and absolute/relative quantities. This can be accomplished using population dynamics (or growth) models in which the estimated parameters are usually biologically meaningful (Van der Plank 1963; Leonard and Fry 1986; Campbell and Madden 1990; Madden et al. 2007). The classical models are the non-flexible ones such as exponential, monomolecular, logistic, and Gompertz, which are appropriate for epidemics that do not present a degressive phase (decrease in disease intensity).
The mathematics behind the fit of these population dynamics models is straightforward and several tutorials with accompanying computer code or standalone software have been prepared to facilitate usage for education or research purposes. A general-purpose statistical environment like SAS or R can be used to perform model fitting to DPC data using either linear or nonlinear regression modeling. Tutorials with an example script using SAS were provided by Neher et al. (1997) in the first edition of Exercises in Plant Disease Epidemiology and later by Jesus Junior et al. (2004) and Madden et al. 2007 in the chapters on temporal analysis of epidemics in Epidemiologia aplicada ao manejo de doenças de plantas (Vale et al. 2004) and Study of Plant Disease Epidemics (Madden et al. 2007), respectively. A tutorial with examples of R codes for calculating AUDPCs, performing comparisons, and fitting models using regression analysis has been published by the APS Education center (Sparks et al. 2008).
An early custom-made software, programmed to run on a PC (DOS-based), called Epimodel has been demonstrated in the first edition of Exercises in Plant Disease Epidemiology (Nutter and Parker 1997). An updated version of Epimodel, programmed in Java and capable of running on any computer system, was presented by Nutter et al. (2015) in the second edition of Exercises in Plant Disease Epidemiology. Finally, in this same second edition, the use of a Microsoft Excel 2007 spreadsheet was illustrated in detail in a tutorial presented by Bowen (2015).
The main objective of this paper is to introduce and illustrate the functionalities and capabilities of the epifitter R package in performing a range of temporal analyses of DPCs including visualization, model fitting and simulation. As a real example, we used published data on the temporal progress of powdery mildew (Leveillula taurica) severity in organic tomato (Solanum lycopersicum) evaluated under different irrigation systems and levels of soil moistures as management tactics (Lage et al. 2019).
Results
The epifitter package allows working with actual or synthetic (simulated) DPCs for single epidemics or replicated experimental data. The latter case is an implementation based on the classic population dynamic models to produce synthetic data with or without uncertainty (random error). Once the data are loaded, other functions allow for: (1) fitting and ranking for the models based on summary stats; (2) comparing model parameters; (3) calculating the area under the disease progress curve; and (4) plotting diagnostic and publication-ready plots via customization of ggplot2 objects (Table 1). Figure 1 summarizes a possible workflow and steps from data import to visualization using epifitter functions.

The workflow and main functions of the epifitter, an R package for temporal analysis of plant disease epidemics
Package availability
The package is available for download on CRAN (The Comprehensive R Archive Network) and can be installed using install.packages(“epifitter”) command. The development version is maintained on GitHub where further installation instructions can be found (github.com/AlvesKS/epifitter).
Example for actual epidemics dataset
To demonstrate the capability of epifitter, we worked with a subset of data from a three-year study on the temporal progress of powdery mildew (Leveillula taurica) in organic tomato (Solanum lycopersicum). The objective of that work was to compare powdery mildew epidemics under the effect of irrigation systems combined with levels of moisture (Lage et al. 2019). We selected the last year of evaluation (2011) and five irrigation systems under different levels of moisture (high or moderate). The full combinations of irrigation system and moisture resulted in eight treatments. Disease severity was evaluated during 73 days following a seven-day interval. This subset of dataset is included in the package and can be loaded by running data(“PowderyMildew”) in R (make sure epifitter has been properly installed and loaded before running it).

Note that we also loaded the tidyverse package, a coherent system of packages for data manipulation, exploration and visualization that share a common design philosophy (Wickham et al. 2019). We demonstrate the use of epifitter here under such philosophy. By filtering a subset of the original PowderyMildew data frame we produced a single curve data frame called single_curve

We then visualized the curve (Fig. 2) with the following code:

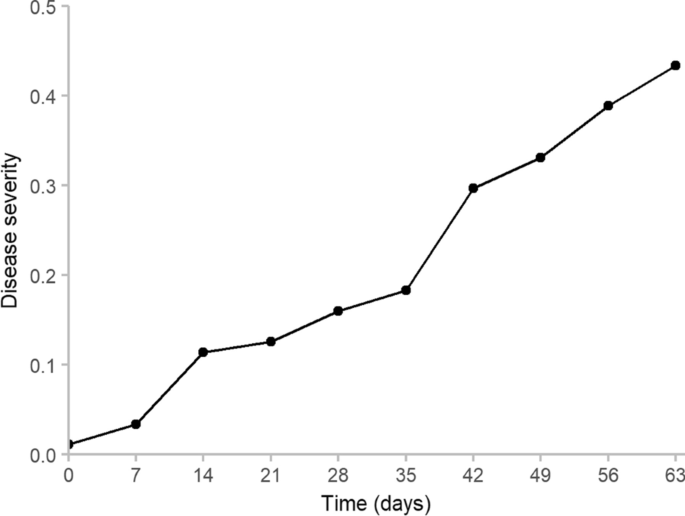
Disease progress curve of powdery mildew (Leveillula taurica) on organic tomato under drip irrigation and high moisture. Data are from a single plot (block 1). (Lage et al. 2019)
Model fitting
Single DPC
Three functions can be used to fit the classic epidemiological models to DPC data. The first, fit_lin() fits the models to the data via linearization, meaning that disease intensity data is transformed according to the model in advance to the fitting procedure, using ordinary linear regression. The linear regression is one of the most commonly used approaches because of its ease of implementation and interpretation (Madden et al. 2007). Although it is quite straightforward to run using native R functions [e.g. lm()], the process might be complicated for those with little or no experience in programming. Here is how to use the function and the respective output:

The second function available is fit_nlin(). It also estimates \(y0\) and \(r\), but instead of using data linearization, it uses nonlinear regression against the actual (non-transformed) disease intensity values. fit_nlin() is a wrapper for nlsLM()function of the minpack.lm package (Elzhov et al. 2016), which implements the Levenberg–Marquardt nonlinear least-squares algorithm (Moré 1978).

Furthermore, to account for situations when maximum disease intensity does not reach y = 1 (100%), the parameter \(K\) was introduced into the models (Campbell and Madden 1990; Gilligan 1990; Kranz 2003; Madden et al. 2007). Therefore, the function fit_nlin2() fits a modification of the two-parameter models to account for this additional parameter as the maximum asymptote. Note that the exponential model is not fitted to the data using this function, because this model lacks \(K\).

Multiple DPCs
The functions for model fitting described above are suitable for fitting models to single epidemics (one curve only). The fit_multi() was designed subsequently to fit the models to multiple epidemics in the same dataset. It is the most flexible function of the package, allowing users to choose between linear and nonlinear regression and whether or not it should estimate \(K\). The user should indicate the data frame name that contains all the data in the data argument. The column names containing the time and disease intensity should be indicated in the arguments time_col and intensity_col, respectively. Other arguments include:
-
strata_col in which the user should indicate the data frame’s column that stratifies the DPCs.
-
nlin: Logical arguments that indicate whether nonlinear regression should be used. If set as TRUE, the user can set starting values for parameters in the starting_par argument, as well as the maximum number of iterations.
-
Estimate_K: A logical argument that indicates whether the maximum asymptote should be estimated.
Caution should be taken when fitting several curves with different topologies and intensities using the fit_multi() function with nonlinear regression (nlin=TRUE). This function requires parameters’ starting values for running the implemented algorithm, and different curve topologies may require different sets of starting values for the parameters, which could cause failure in achieving convergence to estimate the model parameters. This problem should not arise when using fit_multi() with model linearization (nlin=FALSE).

This code generates an object (in this case, fit pd) of the list type. The list contains two data frames: Parameters and Data. The Parameters data frame contains the estimated parameters for each respective model in each level of the strata informed in the function. It also displays the goodness of fit of each model to each respective DPC (the available goodness of fit parameters is presented in the section ‘model summary and goodness of fit’). We can visualize the Parameters data frame using fit_pd$Parameters. Another data frame available in the generated object is called Data, which contains the original data used for model fitting as well as the predicted values of disease intensity and residual values (actual minus predicted values) for each model and DPC. We can access the Data data frame using fit_pd$Data.
Model summary and goodness of fit
Three statistics were calculated for all model fitting functions to inform on the model goodness-of-fit, including the coefficient of determination (r2), the residual standard error (RSE), and Lin’s concordance correlation coefficient (CCC) (Lin 1989). To facilitate interpretation and model selection by users, the models were sorted by the value of CCC from highest to lowest in the summary output (Fig. 3). The model summary includes the estimated values (Estimate), standard errors (Std.error), lower (Lower) and upper (Upper) confidence intervals (95%) for the model parameters (infection rate, initial inoculum, and maximum asymptote, in the case of the fit_nlin2() function). The summary on fit_lin() displays the estimated values of y0 (Estimate), its linearized form y0* (Linearized), and the standard error of the estimate of y0* (lin.SE).

Output of the fit_lin() applied to the DPC from the single_curve data frame
Model fit visualization
epifitter allows producing plots for the fitted models using the ggplot2 package (Wickham 2016). The plot_fit() function produces a panel with the models’ curves (as lines) and the DPC data (as points) (Fig. 4). Currently, there are options for plotting only a specific curve model and adjusting line and point sizes. Furthermore, since the function was built using ggplot2 grammar, the user can customize the graph by modifying color pallets, axis labels, faceting arrangement, and other customization functions provided in ggplot2.

Panel plot output of the plot_fit() function obtained from the output of model fitting using the function fit_nlin(). The panel presents the simulated data (dots) and the fitted models in solid lines: Gompertz, Logistic and Monomolecular
To use the function, users first need to fit the models using fit_lin(), fit_nlin(), or fit_nlin2(), and have the object of one of these functions put into the plot_fit(), as shown below:

Model fit visualization can also be performed from the fit_multi() output using the Data data frame. However, the user should use the functions provided in the ggplot2 package to generate the graph. Here, we generate a publication-ready figure containing the Gompertz model curves for each treatment and the actual DPC data in the same plot (Fig. 5).


Gompertz model fitted curves (lines) to disease progress data (dots) of powdery mildew (Leveillula taurica) in organic tomato for different irrigation systems under two levels of soil moisture (Lage et al. 2019)
Simulation
Four functions produce simulated DPCs that typically represent monocyclic or polycyclic epidemics (e.g. sim_logistic, Table 1). The arguments for running any of these functions are:

The alpha argument assumes normality with mean \(y\) and standard deviation \(\sigma\) at each time point. A correction was introduced for the standard deviation to be a function of disease intensity assuming that variance decreases as \(y\) approaches the asymptotes 0 and 1, which is given by
in which \({y}_{i}\) is the mean disease intensity at each time point \(i\) (\(i = 1,2, \ldots ,N\)). Alternative probability distributions can be used and, therefore, the output also returns mean disease intensity values without the replicates.
The following example generates simulated data using the estimated parameters of the Gompertz model for the DPC from the single_curve data frame. We used 4 replicates, with the same time length (63 days) and interval (7 days), and alpha = 0.1.

To illustrate the epifitter apparatus designed for simulating DPC using population growth models, we gathered the model parameters estimated from the actual data to simulate DPCs using the specific function for the Gompertz model: sim_gompertz(). We simulated curves for all treatments considering 4 replicates at each time point. To add variability to the simulated data, we used alpha = 0.1 (value arbitrarily chosen based on the visualization of the actual data variability). Simulated data are depicted in Fig. 6, in which diamond dots represent the simulated values and the lines represent the model curve fitted to the actual data. See the ‘Open source and reproducibility’ subsection in the Methods section for the link to access the code to reproduce the simulations and figure plotting.

available at git.io/JnTSU
Simulated data (diamond dots) using the function sim_gompertz() and Gompertz fitted curves obtained from model fitting with the fit_multi() function. Codes for reproducing this figure are
Area under disease progress curves and stairs
Two functions, AUDPC() and AUDPS(), are available to calculate the areas under the disease progress curve (AUDPC) and area under the disease progress stairs (AUDPS), respectively. The areas for the single curve dataset can be obtained as follows:

The functions should work using these two arguments, however, if the disease intensity is given in percentage, the user needs to set the argument y_proportion =FALSE. To calculate the areas in relative terms, the user should set type = relative.
Usually there are more than one curve to obtain the areas under the curve/stairs, which can be done using two handy functions of the tidyverse: group_by() and summarise(). For the full dataset, this can be obtained as follows:

These lines of code should generate a data frame containing the columns used for grouping (columns inside group_by()) and two additional columns: audpc and audps, which were created in the summarise() function.
Discussion
Prior to epifitter, model fitting tutorials for scripting languages have been made available for R and SAS, but not organized as a package with convenient user-level functions. To our knowledge, epifitter is the second suite of functions organized as an R package for the analysis of plant disease epidemics, but the first to focus on temporal analysis. epiphy is an R package specialized in spatial analysis of plant disease epidemics and full documentation can be found in the package's vignettes (Gigot 2018).
We further compared epifitter with two fully functional applications that have been made available for facilitating the fitting or simulating population growth models to DPC data. The first is the EPIMODEL, early developed during the mid-1990s and re-programmed in Java language twenty years later to run in the current stationary platforms. EPIMODEL fits five models (the linear model that is not available in epifitter) but does not offer the option to estimate the curve’s maximum asymptote. The authors of EPIMODEL do not make clear which method should be used for model fitting (presumably linear modeling), and unlike epifitter, the software does not rank the best-fitted model, besides producing an r2 statistics. The application produces several plots but they cannot be customized for publication.
Bowen (2015) made available an Excel spreadsheet in which one can modify the parameters and simulate curves for six population growth models (Table 2). A missing feature is the possibility to fit the models to data, whereas this is central to both EPIDMODEL and epifitter. On the other hand, the spreadsheet is very straightforward to use and has several annotations with clear explanations on each model. Clearly, epifitter incorporates most of the features offered by these two reviewed applications, and extra ones such as the calculation of areas under the curve, which had been made available as a function in another R package designed for statistical analysis of agricultural data (agricolae; de Mendiburu and Yaseen 2020), and in an online tutorial (Sparks et al. 2008).
As part of the package improvement and maintenance, we should focus on correcting possible bugs, expanding existing functions, and developing new dedicated functions. The users of epifitter are therefore encouraged to open any kind of issues (https://github.com/AlvesKS/epifitter/issues), such as requests for improvement, bug reports, etc.
New features that are planned for future versions of epifitter include: (a) functions for fitting flexible (three-parameter) models such as the Richard and Weibull models (Madden et al. 2007); (b) improving the functions for comparing multiple epidemics from experiments conducted under different experimental designs (e.g. CRD, CRBD); (c) functions for fitting spatial gradient models; and (d) inclusion of DPC datasets for aiding in teaching and training.
Conclusions
To our knowledge, epifitter is the first comprehensive toolbox that facilitates the analysis of single or multiple epidemics. Analysis can be performed via choosing different models and using different model fitting procedures. Furthermore, the package enables users to perform stochastic epidemic simulations for scenario analysis. Finally, it provides functions for preparing and customizing publication-ready reports and graphics.
Since epifitter was coded using the R language, an environment for statistical computing and graphics (R Core Team 2020), it has offered an open-source and free option for data analysis in all areas of science. The codes produced can be run in any machine with R installed, which facilitates reproducibility. The integration with other packages (e.g. dplyr, ggplot2) having common data structures and grammar (Wickham et al., 2020) allows users to run analysis that could be troublesome for those with no or little computational background.
Methods
Model fitting
To obtain the function fit_lin(), fitting of the population growth models using data linearization was done as described by Madden et al. (2007), and the linearized forms of these models, Eqs. 2 to 5, respectively, were fitted using ordinary linear regression to the transformed DPC data. Transformation was done as shown in the equations (left side of the equation):
\(r_{E}\), \(r_{M}\), \(r_{L}\), and \(r_{G}\) indicate the apparent infection rate for each respective model, \(K\) represents the model maximum asymptote, \(t\) represents the time and \(y\) indicates the disease intensity. To develop the function fit_nlin() and fit_nlin2(), nonlinear regression was performed using the integral form of the models. The integral form of the monomolecular, logistic, and Gompertz models can be found in Madden et al. (2007, p. 110, table 4.4). The nlsLM() function of the minpack.lm package (Elzhov et al. 2016) was used to perform nonlinear regression using the Levenberg–Marquardt Algorithm.
Simulation of synthetic DPCs datasets
To simulate the DPCs, we used the differential forms of the exponential, monomolecular, logistic, and Gompertz models, given by Eqs. 6 to 9, respectively.
The function ode() from the deSolve package (Soetaert et al. 2010) was used to simulate the DPC for each respective model. The disease intensity in a specific time point \(t\), that is \(y_{i}\), was assumed to be normally distributed with mean \(\mu = y_{i}\), in which \(i = 1,2, ..., N\) (\(N\) is the total number of time points). The standard deviation was given by Eq. 1.
Area under disease progress curves and stairs
Equations 10 and 11 were used to calculate the AUDPC and AUDPCS, respectively (Simko and Piepho 2012).
Open-source and reproducibility
The R codes used to assemble the functions that constitute the epifitter are available on GitHub (git.io/JnTSo). All codes used in this manuscript were fully documented using R markdown from which a website was generated to facilitate reproducibility (git.io/JnTSU).
Availability of data and materials
The datasets generated and/or analyzed during the current study are available in the GitHub repository, https://osf.io/xkfym/.
Abbreviations
- AUDPC:
-
Area under the disease progress curve
- AUDPS:
-
Area under the disease progress stairs
- DPC:
-
Disease progress curves
References
Bowen KL. Models of disease progress. In: Stevenson KL, Jeger MJ, editors. Exercises in plant disease epidemiology, 2nd edn. St Paul: The American Phytopathological Society. 2015. p. 9–15. https://doi.org/10.1094/9780890544426.001.
Campbell CL, Madden LV. Introduction to plant disease epidemiology. New York: Wiley; 1990.
de Mendiburu F, Yaseen M. Agricolae: statistical procedures for agricultural research. 2020. https://CRAN.R-project.org/package=agricolae. Accessed 3 March 2021.
Elzhov TV, Mullen KM, Spiess A-N, Bolker B. minpack.lm: R interface to the Levenberg-Marquardt nonlinear least-squares algorithm found in MINPACK, plus support for bounds. 2016. https://CRAN.R-project.org/package=minpack.lm. Accessed 3 March 2021.
Gigot C. epiphy: analysis of plant disease epidemics. 2018. https://CRAN.R-project.org/package=epiphy. Accessed 3 March 2021.
Gilligan CA. Comparison of disease progress curves. New Phytol. 1990;115(2):223–42. https://doi.org/10.1111/j.1469-8137.1990.tb00448.x.
Jesus Junior WC, Pozza EA, Vale FXR, Aguilera GM. Análise temporal de epidemias. In: Vale FXR, Jesus Junior WC, Zambolim L, editors. Epidemiologia aplicada ao manejo de doenças de plantas. Belo Horizonte: Perfil Editora; 2004. p. 127–91.
Kranz J. Comparative epidemiology of plant diseases. Berlin: Springer; 2003. https://www.springer.com/gp/book/9783540436881.
Kranz J, Rotem J, editors. Experimental techniques in plant disease epidemiology. Heidelberg: Springer; 1988. https://doi.org/10.1007/978-3-642-95534-1.
Lage DAC, Marouelli WA, Café-Filho AC. Management of powdery mildew and behaviour of late blight under different irrigation configurations in organic tomato. Crop Prot. 2019;125:104886. https://doi.org/10.1016/j.cropro.2019.104886.
Leonard KJ, Fry WE, editors. Plant disease epidemiology: population dynamics and management. New York: MacMillan; 1986.
Lin I-K. A concordance correlation coefficient to evaluate reproducibility. Biometrics. 1989;45(1):255–68. https://doi.org/10.2307/2532051.
Madden LV, Hughes G, van den Bosch F. The study of plant disease epidemics. St Paul: APS Press; 2007. https://doi.org/10.1094/9780890545058.
Moré JJ. The Levenberg–Marquardt algorithm: implementation and theory. In: Watson GA, editor. Numerical analysis: lecture notes in mathematics, vol 630. Berlin: Springer; 1978. p. 105–16. https://doi.org/10.1007/BFb0067700.
Neher DA, Reynolds KL, Campbell CL. Analysis of disease progress curves using linear models. In: Francl LJ, Neher DA, editors. Exercises in plant disease epidemiology. 1st ed. St Paul: APS Press; 1997. p. 29–33.
Nutter FW, Parker KS. Fitting disease progress curves using EPIMODEL. In: Francl LJ, Neher DA, editors. Exercises in plant disease epidemiology. 1st ed. St Paul: APS Press; 1997. p. 24–8.
Nutter FW, Eggenberger SK, Littlejohn KJ. Visualizing, describing, and modeling disease progress curves using EPIMODEL. In: Stevenson KL, Jeger MJ, editors. Exercises in plant disease epidemiology (2nd ed). St Paul: APS Press; 2015. p. 21–30. https://doi.org/10.1094/9780890544426.003
R Core Team. R: A language and environment for statistical computing. Vienna, Austria: R Foundation for Statistical Computing; 2020. https://www.R-project.org/.
Simko I, Piepho H-P. The area under the disease progress stairs: calculation, advantage, and application. Phytopathology. 2012;102(4):381–9. https://doi.org/10.1094/PHYTO-07-11-0216.
Soetaert K, Petzoldt T, Setzer RW. Solving differential equations in R: package deSolve. J Stat Softw. 2010;33(9):1–25.
Sparks AH, Esker PD, Bates M, Dall’Acqua W, Guo Z, Segovia V, et al. Ecology and epidemiology in R: disease progress over time. The Plant Health Instructor. 2008. https://doi.org/10.1094/PHI-A-2008-0129-02.
Vale FXR, Jesus Junior WC, Zambolim L. Epidemiologia aplicada ao manejo de doenças de plantas. Belo Horizonte Editora Perfil; 2004.
Van der Plank JE. Plant diseases: epidemics and control. New York: Academic Press; 1963.
Wickham H. ggplot2: elegant graphics for data analysis. 2nd ed. AG Switzerland: Springer Nature; 2016.
Wickham H, Averick M, Bryan J, Chang W, McGowan LD, François R, et al. Welcome to the tidyverse. J Open Sour Softw. 2019;4(43):1686. https://doi.org/10.21105/joss.01686.
Wickham H, François R, Henry L, Müller K. dplyr: a grammar of data manipulation. R package version 1.0.2. 2020. https://CRAN.R-project.org/package=dplyr.
Acknowledgements
The first author is thankful to the Coordenação de Aperfeiçoamento de Pessoal de Nível Superior – Brasil (CAPES) for his scholarship. The second author received a research fellowship from Conselho Nacional de Desenvolvimento Científico e Tecnológico (CNPq)/Brazil.
Funding
This study was financed in part by the ‘Coordenação de Aperfeiçoamento de Pessoal de Nível Superior—Brasil’ (CAPES)—Finance Code 001.
Author information
Authors and Affiliations
Contributions
KSA conceptualized and developed the package and wrote the manuscript, EMD conceptualized and coordinated the project and wrote the manuscript. Both authors read and approved the final manuscript.
Corresponding author
Ethics declarations
Ethics approval and consent to participate
Not applicable.
Consent for publication
Not applicable.
Competing interests
The authors declare that they have no competing interests.
Rights and permissions
Open Access This article is licensed under a Creative Commons Attribution 4.0 International License, which permits use, sharing, adaptation, distribution and reproduction in any medium or format, as long as you give appropriate credit to the original author(s) and the source, provide a link to the Creative Commons licence, and indicate if changes were made. The images or other third party material in this article are included in the article's Creative Commons licence, unless indicated otherwise in a credit line to the material. If material is not included in the article's Creative Commons licence and your intended use is not permitted by statutory regulation or exceeds the permitted use, you will need to obtain permission directly from the copyright holder. To view a copy of this licence, visit http://creativecommons.org/licenses/by/4.0/.
About this article

Cite this article
Alves, K.S., Del Ponte, E.M. Analysis and simulation of plant disease progress curves in R: introducing the epifitter package. Phytopathol Res 3, 22 (2021). https://doi.org/10.1186/s42483-021-00098-7
Received:
Accepted:
Published:
DOI: https://doi.org/10.1186/s42483-021-00098-7